- According to recent research, the Bitcoin (BTC) market is on a downward trend.
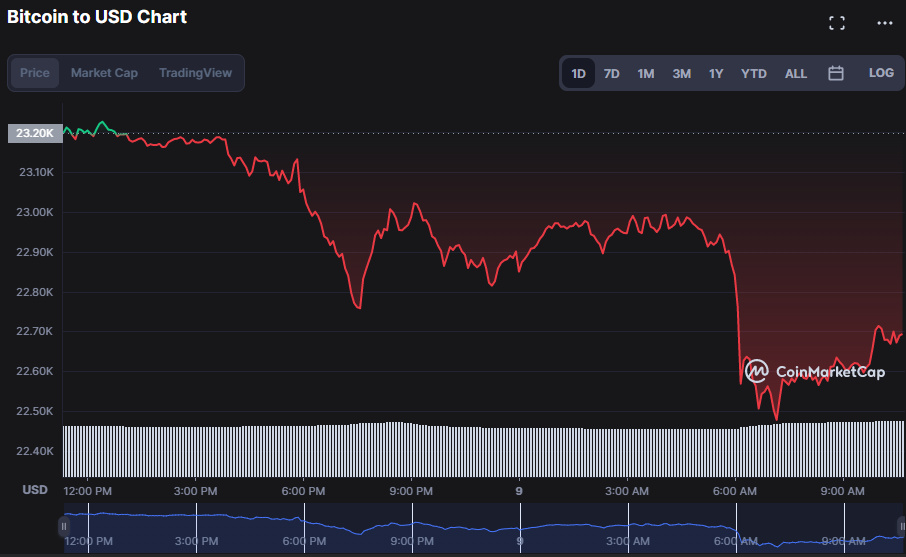
- BTC price ranges between $22,458.26 and $23,229.80 on the last day.
- Bearish momentum is gaining, based on indicators.
The day started with ביטקאָין (בטק) gaining bullish traction, but it soon ran across resistance around $23,229.80. Prices have been retracing in the previous 24 hours after hitting this resistance before finding support at the intra-day low of $22,458.26. At the time of publication, the bears had succeeded in pushing the בטק פּרייַז down to $22,716.20, a plunge of 2.14%.
During the downturn, market capitalization dropped 2.05% to $438,540,372,519, while 24-hour trading volume increased 10.18 % to $29,443,008,626. This high trading volume indicates that the market is very liquid and volatile, suggesting that additional negative corrections may be possible in the following hours.
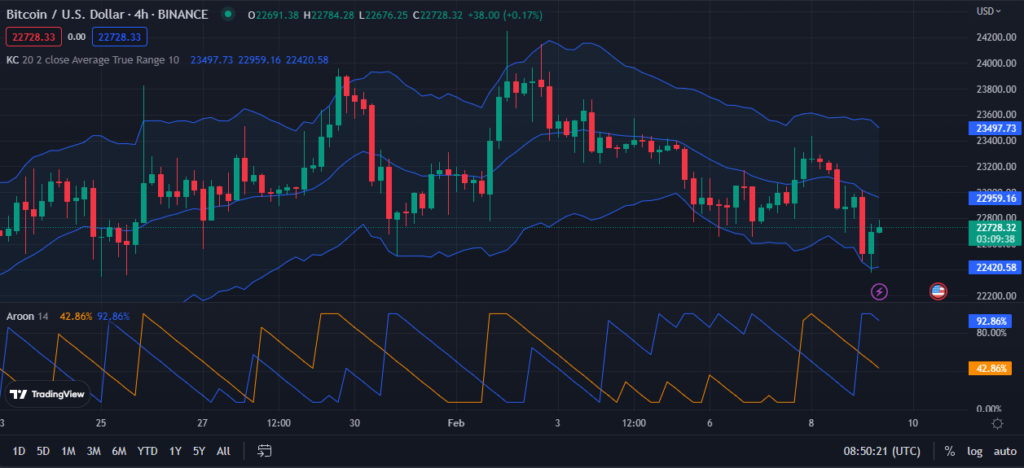
On the 4-hour price chart, the Keltner Channel bands are trending south, with the upper band at $23498.83 and the lower band at $22420.91, reflecting a robust negative mood in the market. This negative momentum indicates substantial bearish pressure in the market, and traders should be cautious about opening any long positions since additional lower volatility is possible.
With the price action approaching the lower band of the Keltner Channel, traders may opt to set a stop-loss order just above the lower bar of the Keltner Channel around $22420.91 to protect against severe losses in the event of an unexpected bearish breakout.
Since the Aroon down crosses over the Aroon up with readings of 92.86% and 42.86%, it implies that the market’s negative pressure is likely to endure, at least in the near term. Moreover, these Aroon readings indicate that bears have been in charge of the need for some time, suggesting that traders should be wary when entering long positions since negative momentum is high.
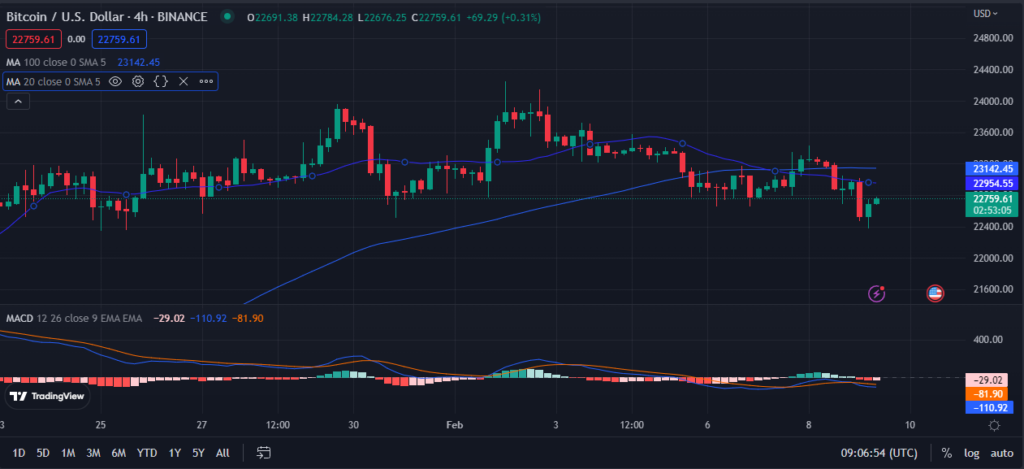
Price levels of $23142.02 and $22952.29 on the 20-day and 100-day moving averages, respectively, indicate a bearish crossing, reflecting a negative trend in market sentiment. This negative crossover suggests a change in opinion from optimistic to pessimistic among traders, which might portend a continuation of the downward trend.
In light of this shift in opinion, investors need to take steps to secure their gains or limit their losses. Because the price movement is heading below both MAs, the pessimistic feeling may linger for some time.
With a value of -112.02, the MACD line also contributes to the bearish forecast by falling below its SMA line. As investors hurry to sell off their holdings to avoid more losses, the market’s direction has turned negative. Additionally, the MACD histogram reflects the pessimistic attitude, with bar sizes that indicate a robust trend in favor of sellers.
Bulls must keep driving prices above the current resistance level if the Bitcoin market wants to break its downward trend.
אָפּלייקענונג: די מיינונגען און מיינונגען, ווי געזונט ווי אַלע די אינפֿאָרמאַציע שערד אין דעם פּרייַז אַנאַליסיס, זענען ארויס אין גוט אמונה. לייענער מוזן טאָן זייער אייגענע פאָרשונג און רעכט דיליאַנס. קיין קאַמף גענומען דורך די לייענער איז שטרענג אין זייער אייגן ריזיקירן, קאָין אַדישאַן און זייַן אַפיליאַץ וועט ניט זיין פאַראַנטוואָרטלעך פֿאַר קיין דירעקט אָדער ומדירעקט שעדיקן אָדער אָנווער.
Source: https://coinedition.com/bears-capture-btc-market-indicators-foretell-adverse-mood-persistence/