Bitcoin has been on a continued downfall after losing close to 33% over the last seven days. In the last 24 hours, BTC lost close to 6% and was moving towards its next support level. There has been immense choppiness in the market, with BTC steadying around the support level of $23,000 and then falling right through that level again.
Bitcoin again bounced off the $20,000 price level as it was trading slightly above that level at the time of writing. Fall from the current price level can push the coin towards the $17,000 support mark.
Traditional financial markets also have suffered the brunt after the US Federal Reserve decided to hike up interest rates by at least 50-basis points.
Sellers have taken over the market as the bears have driven all the buyers out of the market at the time of writing.

ביטקאָין פּרייַז אַנאַליסיס: איין טאָג טשאַרט
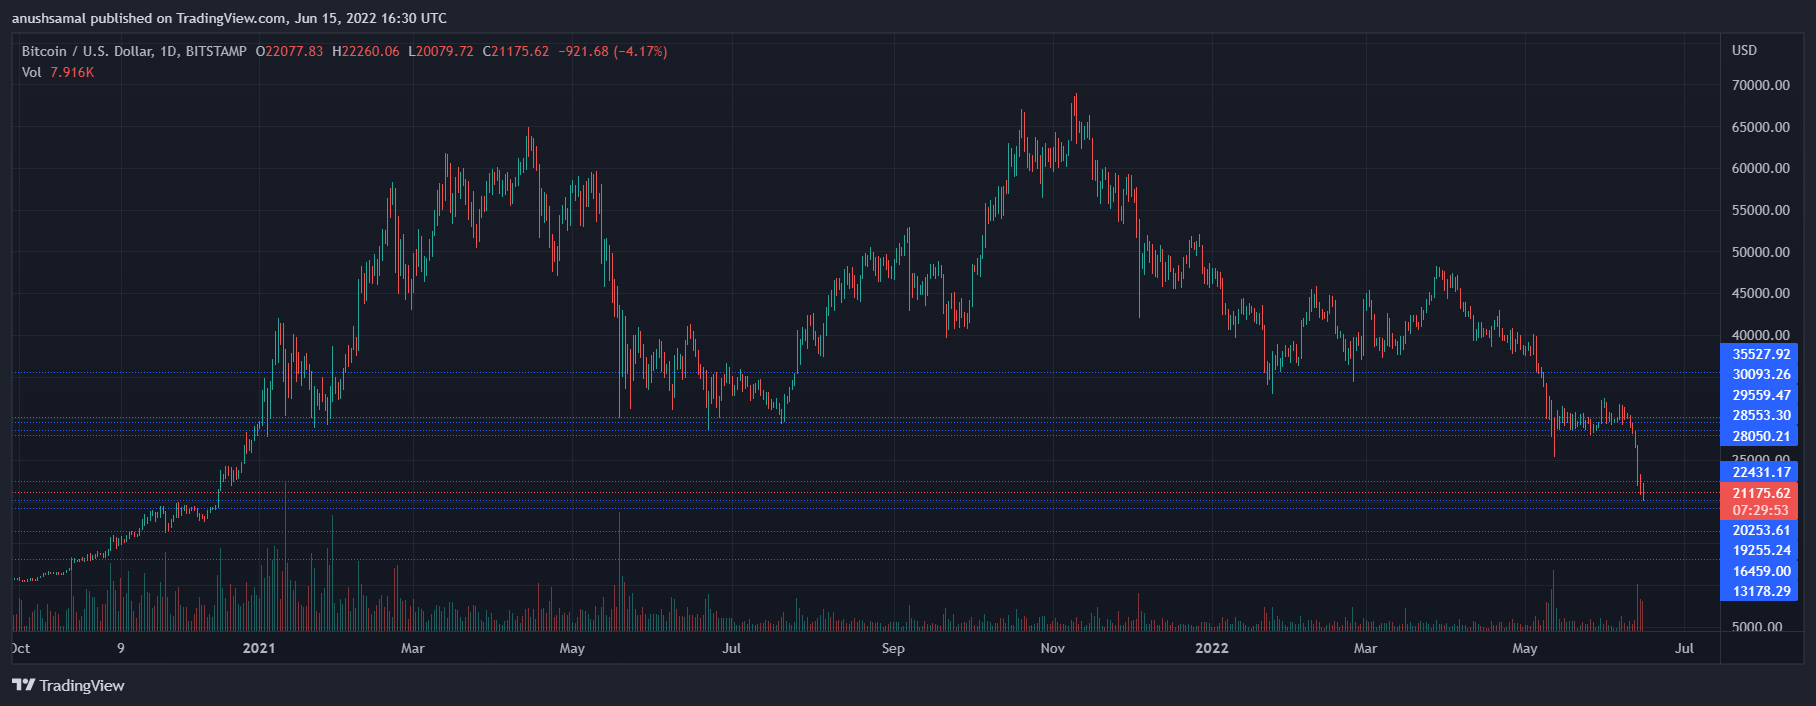
BTC was priced at $21,000 on the one day chart. BTC last traded at this price level in the month of December of 2020. It has been a consistent fall for BTC after the coin lost support at $28,000. Immediate resistance level for the coin stood at $22,000.
The support zone was between $19,000 and $16,000 respectively. Consistent sell off can push BTC to $13,000 going by the massive bearish momentum the coin has gathered. Volume of Bitcoin traded increased and was in red signifying bearish assertion in the market.
טעכניש אַנאַליסיס
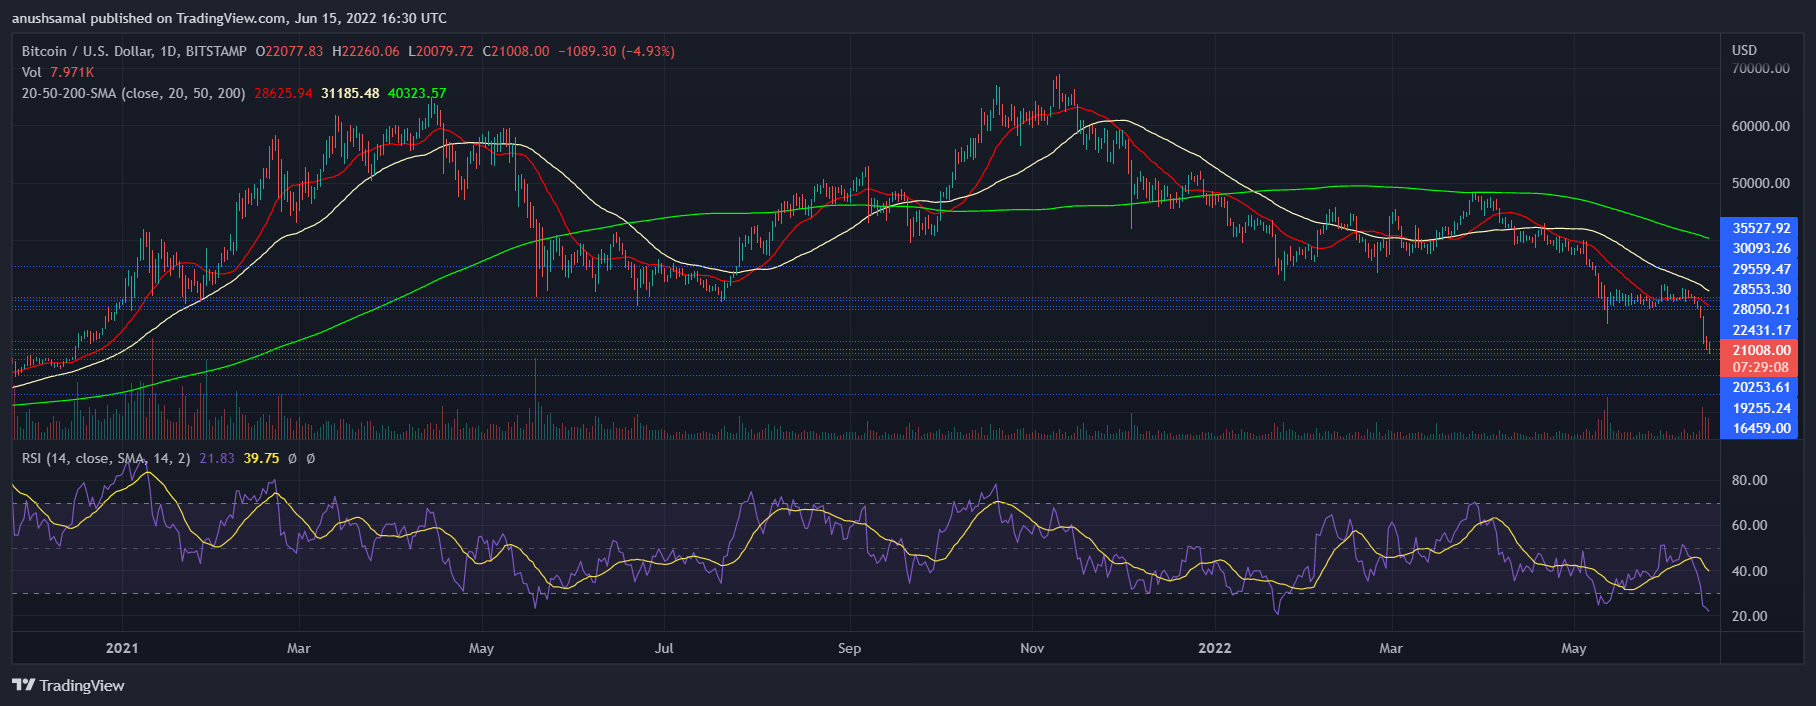
Buying strength plummeted sharply on the one day chart. The cryptocurrency was massively undervalued at the time of writing. The Relative Strength Index was beneath the 20-mark which is a sign of bearishness. RSI pointed towards seller strength in the market.
A price reversal usually occurs after an intense sell-off. The other indicators however hint that bearishness might continue over the immediate trading sessions. Price of BTC was below the 20-SMA which signalled that sellers were driving the price momentum in the market.
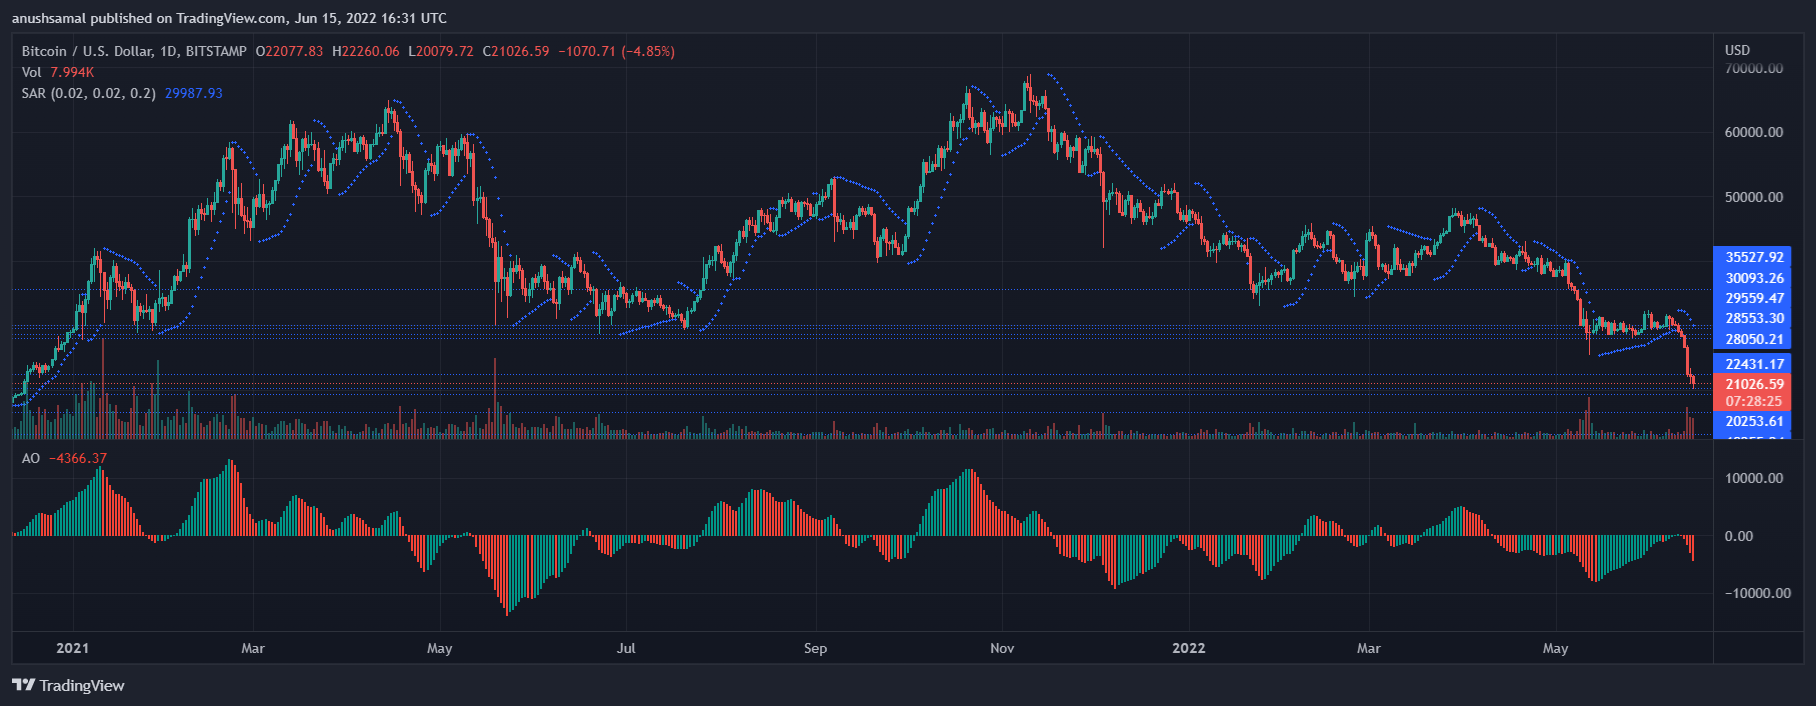
In accordance to increased selling strength, other indicators have painted the same picture on the one day chart. Awesome Oscillator determines the price momentum and possible trend reversals too. AO flashed red histograms which were tied to a sell signal in the market.
Parabolic SAR points towards the direction in which the price is moving. Dotted lines above the candlesticks indicate that price of the asset was on a downtrend. This meant bearishness for the coin. If the buying strength comes back to the market, BTC might attempt to trade near the $22,000 price level.
פֿאַרבונדענע רידינג | TA: Bitcoin Shows Signs of Recovery, $23K Presents Resistance
What Does The Metric Say About Investors?
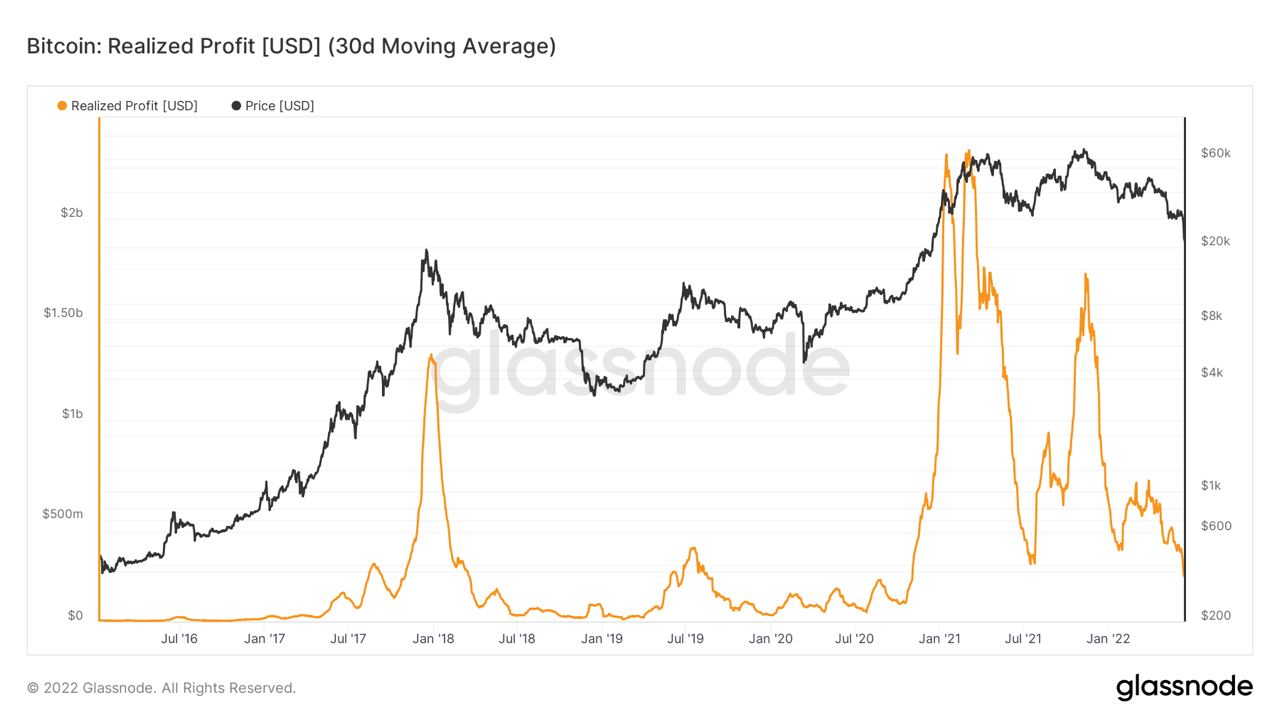
Realised Profits of Bitcoin have seemed to depreciate owing to the extended bloodbath in the market. Realised profits is the total amount of profits which have been made with each completed trade.
A fall in realised profits could cause retail investors to withdraw their investments. With increased outflows, it is possible that investors might lose confidence and withdraw their investments.
פֿאַרבונדענע רידינג | ביטקאָין קראַש סענדז ינסטיטושאַנאַל ינוועסטערז פליסנדיק פֿאַר די היללס
Source: https://www.newsbtc.com/news/bitcoin-amidst-relentless-sell-off-is-it-targeting-13000-now/