ליטעקאָין פּרייַז analysis reveals that the digital asset is currently in a bearish extension after it found resistance at $55.31. The bulls had attempted to push prices higher but failed as the market found support at $51.36, and if the market breaks below this level, it is likely to head towards the $51.00 level. On the other hand, if the bulls can push prices above $55.31, the market is expected to lead towards the $56.00 level, as the bears are currently in control of the market, and a further decline is expected.
The digital asset is currently trading at $51.88 at the time of writing, which is a 5.88% decline in the last 24 hours. The cryptocurrency has a market trading volume which is at $493,625,335, with a market capitalization of $ 3,693,999,182.
LTC/USD 1-day price chart: Bears mount pressure on LTC prices
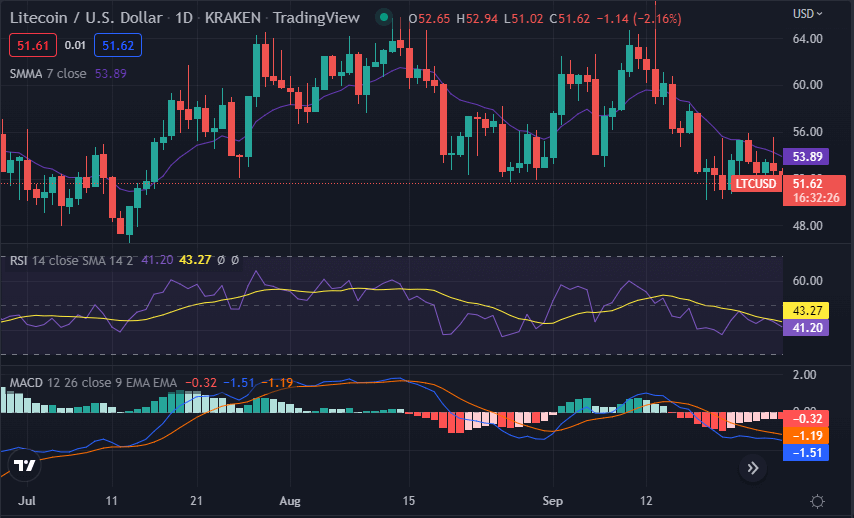
The 1-day Litecoin price analysis shows that the LTC/USD has been on a downtrend for the last 24 hours. The next few hours of trading are crucial for the market as the market is expected to make a move in either direction. Bulls might try to push prices above $55.31 while bears will look to extend the decline and take prices below $51.36.

The RSI indicator is currently at 43.27 and is signaling a bearish extension in the market as it heads towards the oversold territory. The 50 SMA is currently at $53.89 and is heading towards the 200 SMA which is located at $51.62. This indicates that the market is bearish and will most likely continue to head lower in the next few hours. The MACD indicator is showing bearish signs as the signal line is above the MACD line, and both are sloping downwards.
LTC/USD 4-hour price analysis: Recent development and further technical indications
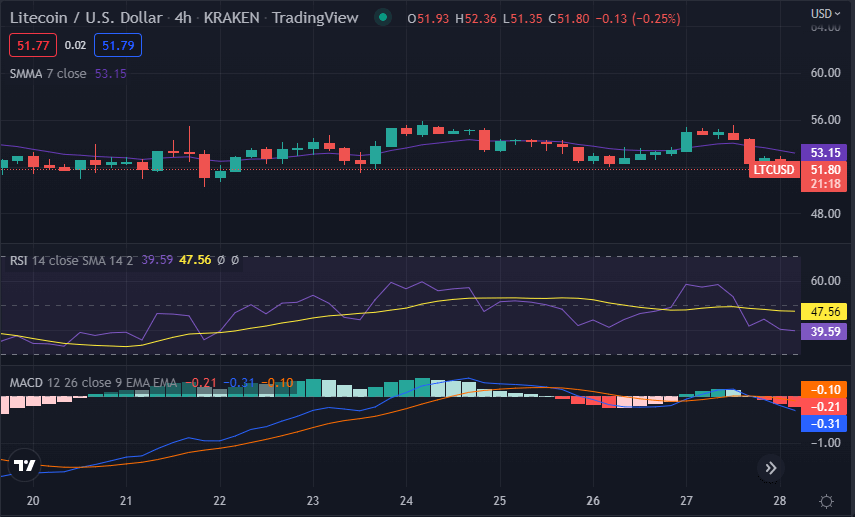
The 4-hour Litecoin price analysis reveals that the market has made higher lows and higher highs which is indicative of a bullish trend. Litecoin price analysis shows that the market follows a positive movement with the market’s volatility entering a declining movement, consequently closing the market. This makes the cryptocurrency price less prone to experience volatile change on either extreme.

The RSI indicator is currently at 47.56 on the 4-hour timeframe and is currently below the 50 level which is a bearish sign. The MACD line is at risk of crossing below the signal line, which is a bearish sign. The 50 MA is currently located at $53.15 while the 200 MA is located at $51.80. This indicates that the market is bearish and is likely to head lower in the next few hours.
מסקנא פון ליטעקאָין פּרייַז אַנאַליסיס
Litecoin price analysis is in a bearish trend as market sentiment remains negative. Prices may continue to fall in the near term as market sentiment remains bearish. The technical indicators show that prices have further fallen as the market is in a bearish trend. Investors are advised to wait for the market to find a bottom before making any long-term investments.
Disclaimer. די אינפֿאָרמאַציע צוגעשטעלט איז נישט טריידינג עצה. Cryptopolitan.com האלט קיין אַכרייַעס פֿאַר ינוועסמאַנץ געמאכט באזירט אויף די אינפֿאָרמאַציע צוגעשטעלט אויף דעם בלאַט. מיר רעקאָמענדירן רעקאמענדירטע פרייַ פאָרשונג און / אָדער באַראַטונג מיט אַ קוואַלאַפייד פאַכמאַן איידער איר מאַכן קיין ינוועסמאַנט דיסיזשאַנז.
מקור: https://www.cryptopolitan.com/litecoin-price-analysis-2022-09-27-2/
